चित्र:Conformal map.svg
नेविगेशन पर जाएँ
खोज पर जाएँ

पूर्वावलोकन PNG का आकार SVG फ़ाइल: ३४३ × ५९९ पिक्सेल दूसरे रेसोल्यूशन्स: १३७ × २४० पिक्सेल | २७५ × ४८० पिक्सेल | ४४० × ७६८ पिक्सेल | ५८७ × १,०२४ पिक्सेल | १,१७३ × २,०४८ पिक्सेल | २,२८७ × ३,९९१ पिक्सेल।
मूल चित्र (SVG फ़ाइल, साधारणतः २,२८७ × ३,९९१ पिक्सेल, फ़ाइल का आकार: २ KB)
सारांश
| विवरण |
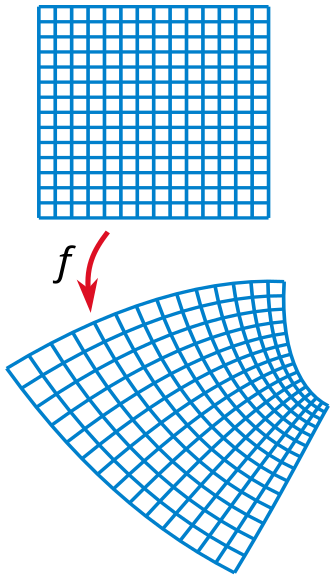
English: Illustration of a conformal map. |
| दिनांक | |
| स्रोत | अपना कार्य |
| लेखक | Oleg Alexandrov |
| SVG genesis |
लाइसेंस
| इस कार्य को इसके लेखक, Oleg Alexandrov द्वारा सार्वजनिक डोमेन में प्रकाशित किया गया है। यह पूरे विश्व में लागू होता है। कुछ देशों में यह कानूनी तौर पर नहीं हो सकता है; ऐसा हो तो: Oleg Alexandrov सभी को इस कार्य का इस्तेमाल किसी भी उद्देश्य से, बिना किसी बाधाओं के इन शर्तों के कानून द्वारा अनिवार्य किए तक करने की अनुमति देता/देती हैं। |
Source code
% Compute the image of a rectangular grid under a a conformal map.

function main()

   N = 15; % num of grid points
   epsilon = 0.1; % displacement for each small diffeomorphism
   num_comp = 10; % number of times the diffeomorphism is composed with itself

   S = linspace(-1, 1, N);

   [X, Y] = meshgrid(S);


   % graphing settings
   lw = 1.0;

   % KSmrq's colors
   red    = [0.867 0.06 0.14];
   blue   = [0, 129, 205]/256;
   green  = [0, 200,  70]/256;
   yellow = [254, 194,   0]/256;
   white = 0.99*[1, 1, 1];

   mycolor = blue;

   % start plotting
   figno=1; figure(figno); clf;

   shiftx = 0; shifty = 0; scale = 1;
   do_plot(X, Y, lw, figno, mycolor, shiftx, shifty, scale)

   I=sqrt(-1);
   Z = X+I*Y;

   % tweak these numbers for a pretty map
   z0 = 1+ 2*I;
   z1 = 0.1+ 0.2*I;
   z2 = 0.2+ 0.3*I;
   a = 0.01;
   b = 0.02;
   shiftx = 0.1; shifty = 1.2; scale = 1.4;
   F = (Z+z0).^2 +a*(Z+z1).^3 +b*(Z+z2).^4;
   F = (1+2*I)*F;

   XF = real(F); YF=imag(F);

   do_plot(XF, YF, lw, figno, mycolor, shiftx, shifty, scale)

   axis ([-1 1.3 -2 2]); axis off;

   saveas(gcf, 'Conformal_map.eps', 'psc2');


function do_plot(X, Y, lw, figno, mycolor, shiftx, shifty, scale)
   figure(figno); hold on;

   [M, N] = size(X);

   X = X - min(min(X));
   Y = Y - min(min(Y));

   a = max(max(max(abs(X))), max(max(abs(Y))));
   X = X/a; Y = Y/a;

   X = scale*(X-shiftx);
   Y = scale*(Y-shifty);

   for i=1:N
      plot(X(:, i), Y(:, i), 'linewidth', lw, 'color', mycolor);
      plot(X(i, :), Y(i, :), 'linewidth', lw, 'color', mycolor);
   end
%   axis([-1-small, 1+small, -1-small, 1+small]);
   axis equal; axis off;
चित्र का इतिहास
चित्र पुराने समय में कैसी दिखती थी यह जानने के लिए दिनांक/समय पर क्लिक करें।
| दिनांक/समय | थंबनेल | आकार | सदस्य | टिप्पणी | |
|---|---|---|---|---|---|
| वर्तमान | ०४:४८, १९ जनवरी २०२५ | | २,२८७ × ३,९९१ (२ KB) | wikimediacommons>Д.Ильин | Optimization |
चित्र का उपयोग
यह पृष्ठ इस चित्र का इस्तेमाल करता है: