चित्र:Generalized factorial function more infos.svg
नेविगेशन पर जाएँ
खोज पर जाएँ

पूर्वावलोकन PNG का आकार SVG फ़ाइल: ५०० × ३१५ पिक्सेल दूसरे रेसोल्यूशन्स: ३२० × २०२ पिक्सेल | ६४० × ४०३ पिक्सेल | १,०२४ × ६४५ पिक्सेल | १,२८० × ८०६ पिक्सेल | २,५६० × १,६१३ पिक्सेल।
मूल चित्र (SVG फ़ाइल, साधारणतः ५०० × ३१५ पिक्सेल, फ़ाइल का आकार: ५४ KB)
सारांश
| विवरण |
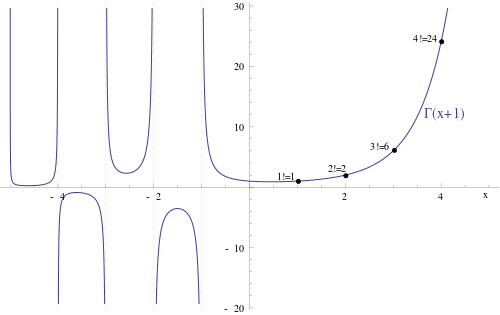
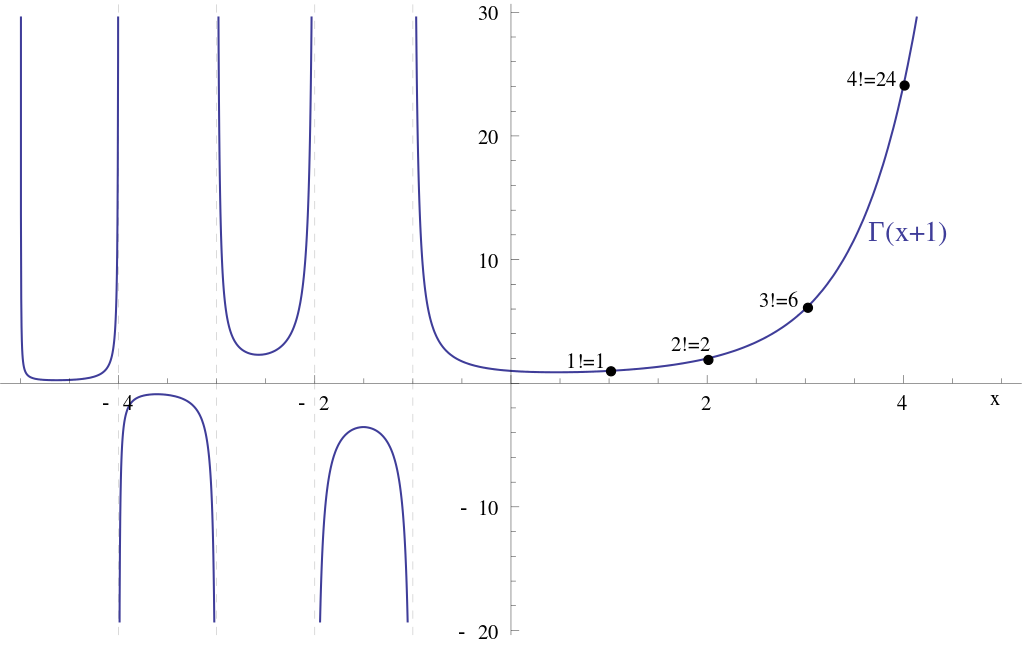
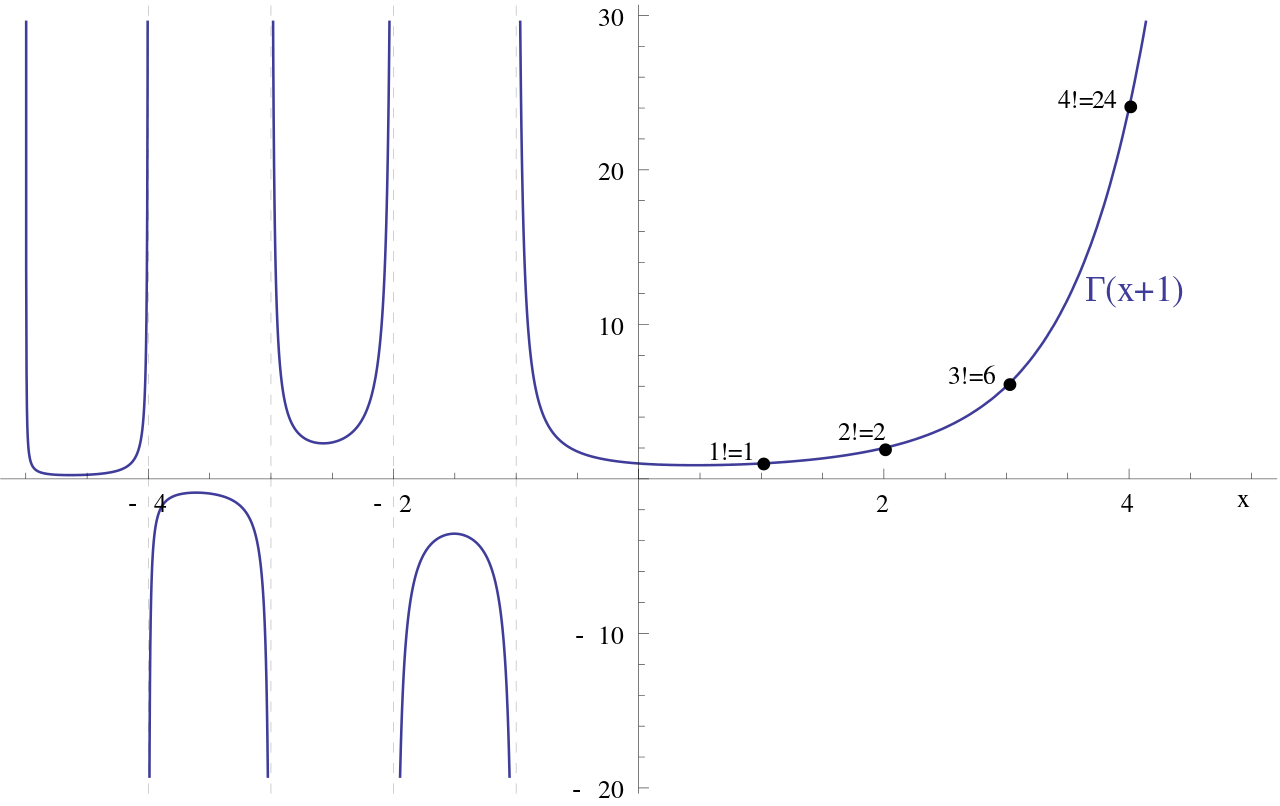
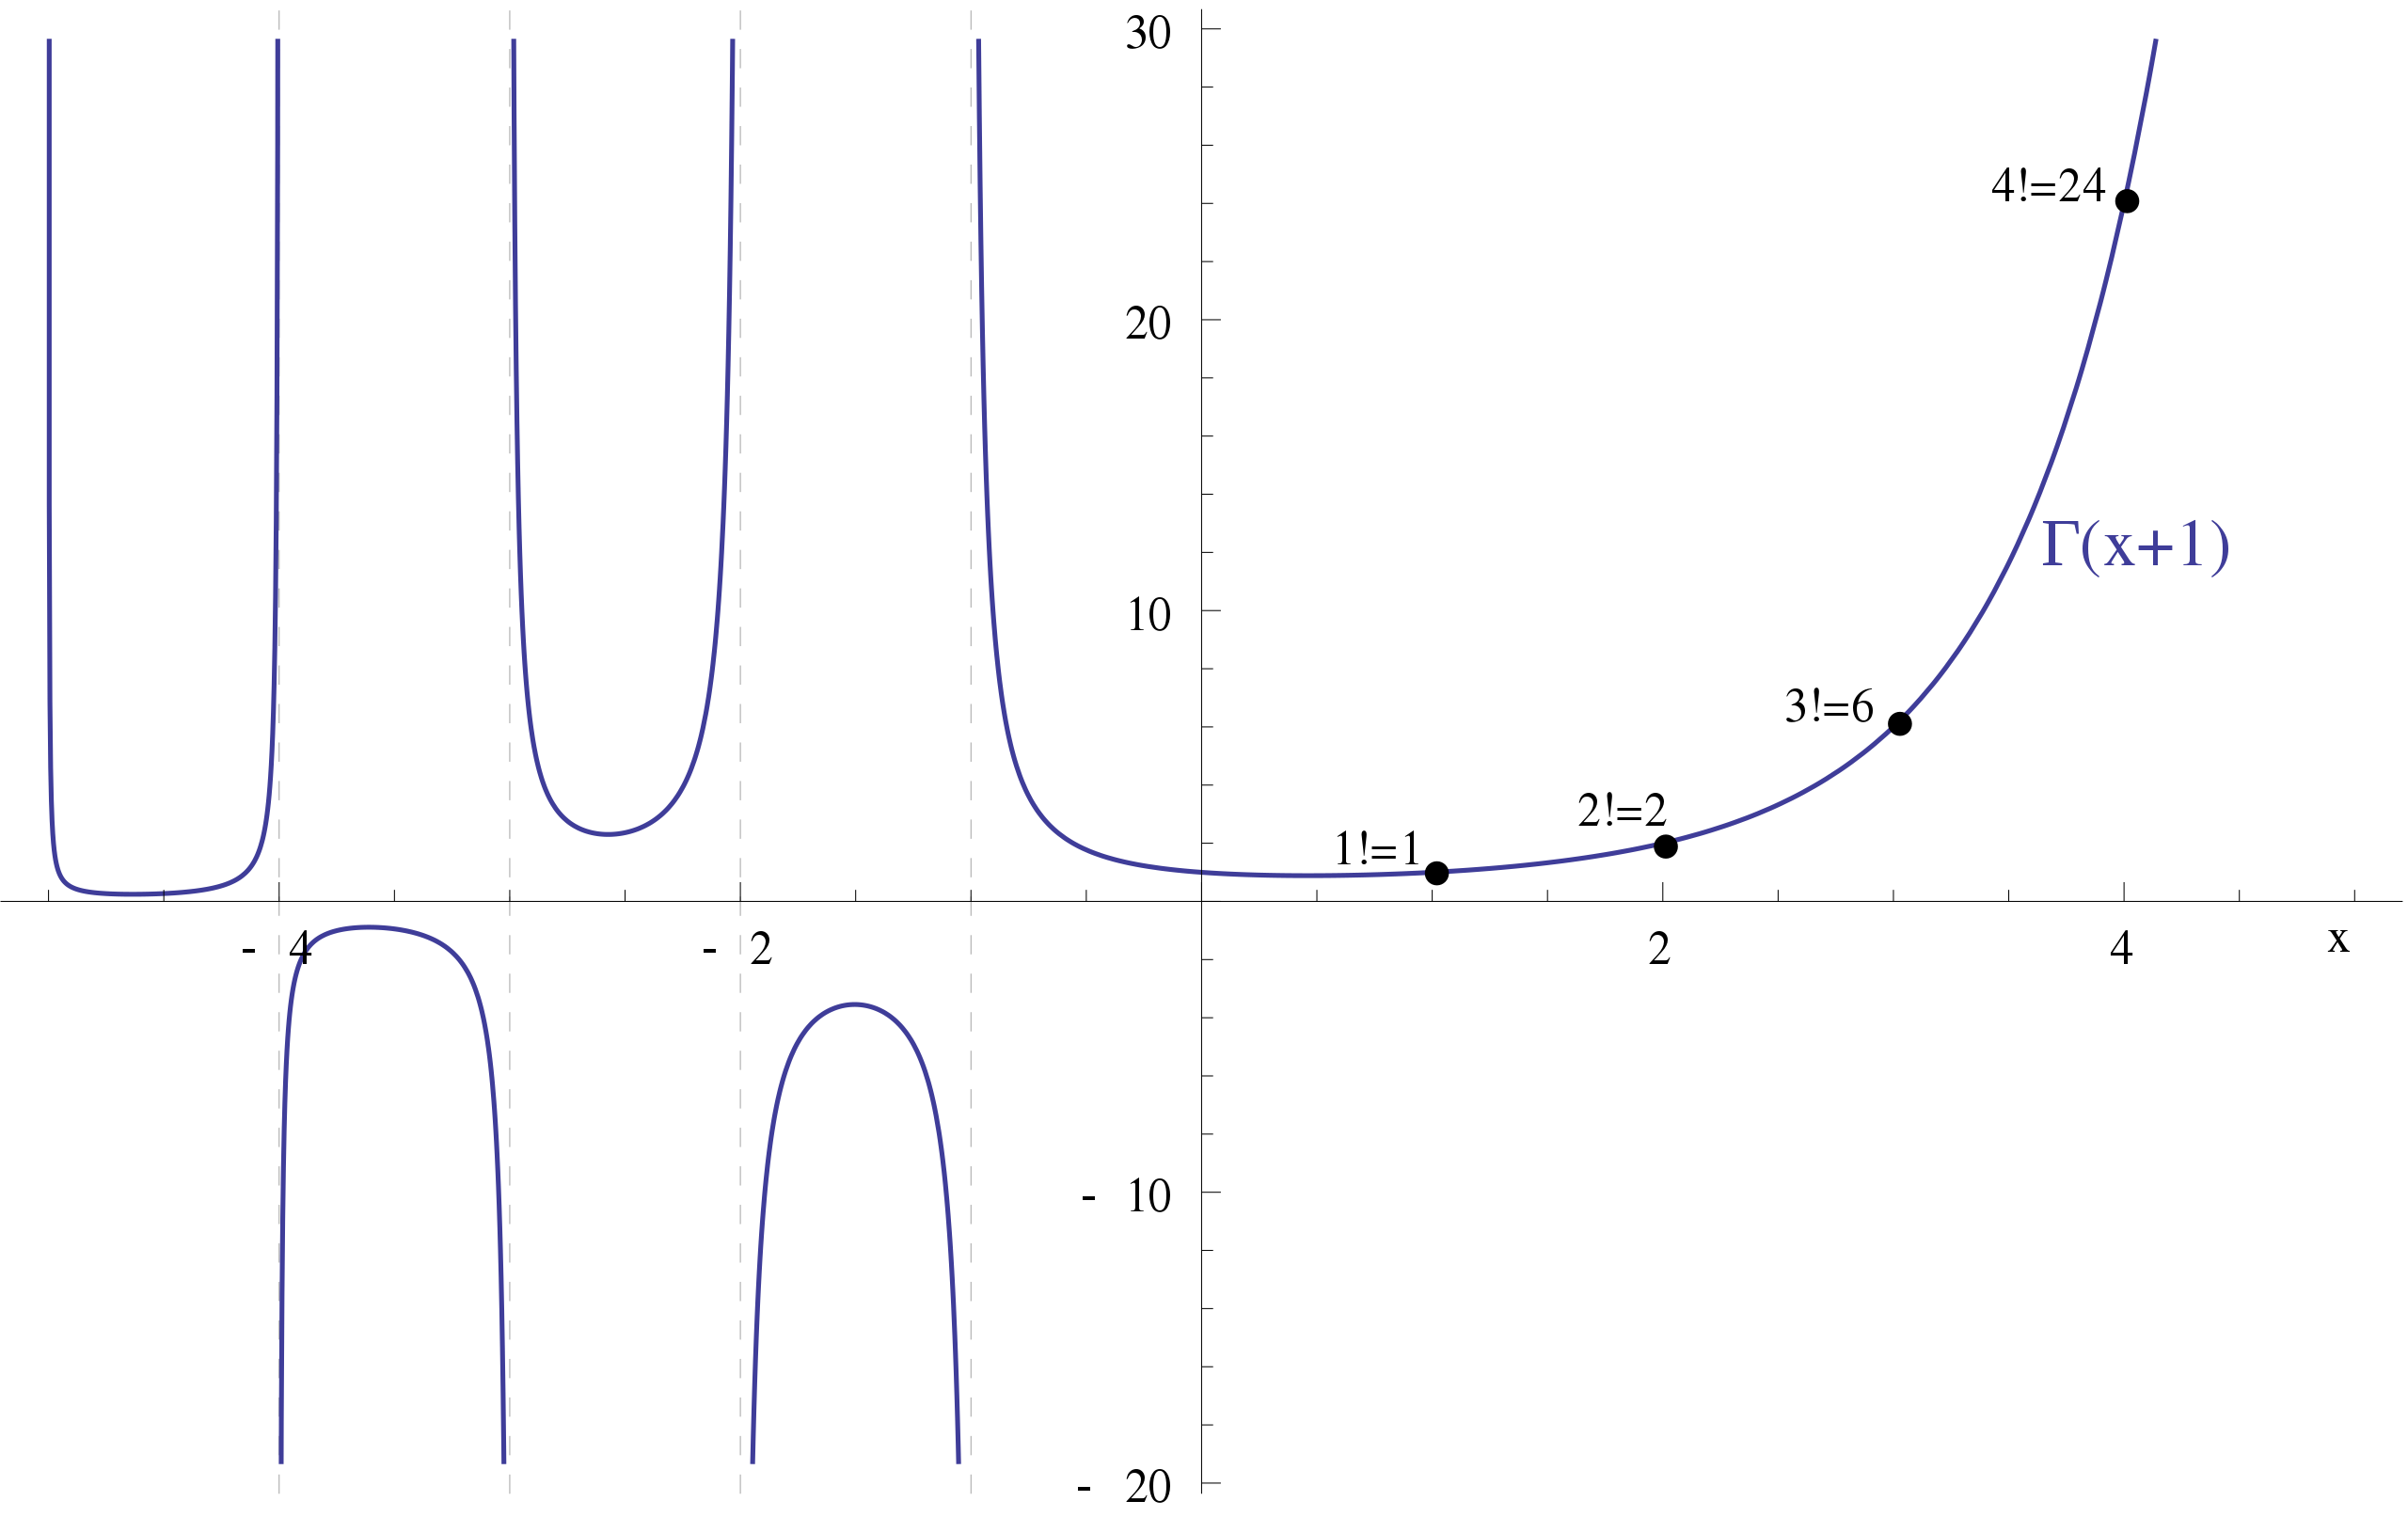
English: Plot of the generalized factorial function over the interval [-5, 5]. |
| दिनांक | |
| स्रोत |
|
| लेखक | Mathmensch based on work of Bender2k14 |
| दूसरे संस्करण |
|

लाइसेंस
| यह चित्र कॉपीराइट के लिए अयोग्य है और इसलिए सार्वजनिक डोमेन में है क्योंकि इसमें सिर्फ ऐसी जानकारी है जो साधारण संपत्ति है और यह मौलिक रचना से मुक्त है। |
चित्र का इतिहास
चित्र पुराने समय में कैसी दिखती थी यह जानने के लिए दिनांक/समय पर क्लिक करें।
| दिनांक/समय | थंबनेल | आकार | सदस्य | टिप्पणी | |
|---|---|---|---|---|---|
| वर्तमान | १७:०८, १९ अप्रैल २०१४ | | ५०० × ३१५ (५४ KB) | wikimediacommons>Mathmensch | bad mistake... |
चित्र का उपयोग
यह पृष्ठ इस चित्र का इस्तेमाल करता है: